
Executive Summary
Our Project Management Critical Success Factors white paper analyzes and discusses the key findings revealed from a sample survey about which project tools and processes correlate most with project success. You may be surprised to read about the unexpected results we found regarding which organizations claimed the most project issues and the value of time tracking.
- Predicting Project Success Through PPM Data Consumption
- Introduction
- The 5 Key Findings Overview
- Tracking Project Financials Correlates with Project Success
- Process Compliance Increases the Ability to Close a Project by 4X
- The Quality of Your Data Matters
- An Unsettling Discovery on the Perception of Project Management
Predicting Project Success Through PPM Data Consumption
A White Paper
Produced by Kolme Group, LLC, May 2019
This document is intended for PMO and Portfolio leaders, their executive sponsors, persons involved in portfolio management, and executives who rely on their project delivery organizations to deliver on strategic objectives.
Summary
Kolme Group conducted a study with over 60 Project and Portfolio leaders at the PMO Symposium in 2018 (white paper update due to release in December of 2023) to try and highlight Project Management Critical Success Factors by answering this fundamental question:
Which Project Tools and Processes Correlate Most with Project Success?
With the data kindly provided by participants, we were able to establish critical correlations between project success and well-adapted toolsets. Further, the respondents’ submissions helped confirm our theory regarding the importance of quality data in establishing a feedback loop that can support business decisions.
There were also some unexpected results regarding which organizations claimed the most project issues and the value of time tracking.
Introduction
At its core, the job of project and portfolio leaders is to enable their organization’s strategic objectives through project delivery. To achieve this, project & portfolio leaders must make hard choices about which tools, governance, and processes should be prioritized to drive a project’s success.
Even with so much at stake, finding resources to help determine which aspects of project tooling and oversight yield the most concrete results can be challenging.
In our decades of experience working with our clients, Kolme Group has identified patterns in how project and portfolio tools, processes, and data are used and the organization’s corresponding ability to deliver projects successfully.
Because of the potential value that understanding these patterns can provide to the community, we leveraged the opportunity to poll attendees at the 2018 PMO Symposium to help us quantify this relationship. We wanted to answer the fundamental question – Which project tools and processes correlate most with project success?
Portfolio and PMO leaders from across the world provided feedback to our study regarding their project success, the tools and processes they use, and how they consume project data.
The results offer some valuable insights. This paper presents our findings, which draw clear correlations between certain PMO behaviors and increased project success.
Survey Method and Respondents
Survey Audience
The Predicting Project Success through PPM Data Consumption survey was conducted at the 2018 PMO Symposium, held 11-14 November in Washington, D.C.
The PMO Symposium is the premier annual global event for leaders of the Project Management Office (PMO) and senior organization decision-makers. 65% of the audience consists of PMO leaders, directors, and executives. The top four industry sectors participating in the event are government, financial services, healthcare, and IT.
Survey Structure and Questions
Invite to participate in the Predicting Project Success and PPM Data Consumption survey was extended via direct communication at the symposium.
Kolme Group provided a tablet to interested participants to complete the 22 questions, and we received over 60 responses before the end of the day and the survey’s close. All reactions were anonymized.
The Survey Predicting Project Success through PPM Data Consumption provided to participants fell into these four general categories:
- General organizational information
- Project management maturity and project types
- Project reporting and data consumption
- Project and portfolio systems processes and integration
- Integrating PM Tools with Other Systems Helps Project Success, Especially Customer Satisfaction
- Everyone Fights Fires, Regardless of Maturity Level
Survey Respondents
-
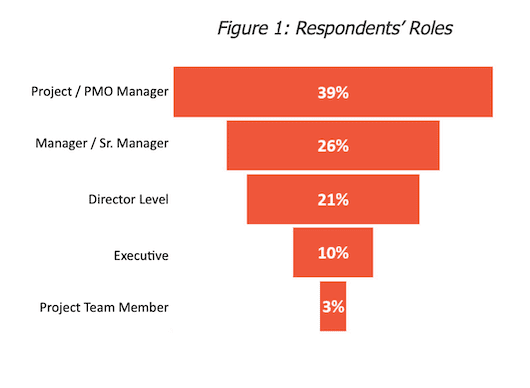
Figure 1: Respondents’ Roles Kolme Group White Paper
As expected, most respondent attendees identified as part of the niche demographic expected to attend the PMO symposium, with the majority (57%) holding leadership roles within their organization and a considerable amount (39%) identifying themselves as PMOs or project managers (Figure 1).
-
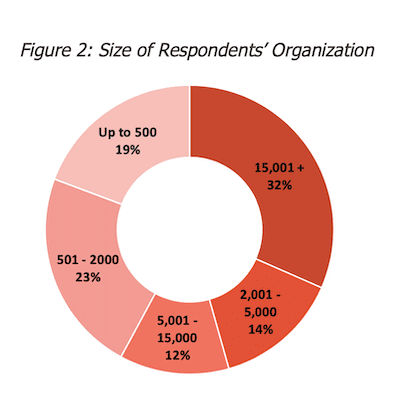
Figure 2: Size of Respondents’ Organization
Additionally, most (58%) respondents came from larger organizations with over 2,000 employees (Figure 2).
How Project Success Was Measured
During the survey, we posed several questions to quantify project success rather than a more subjective, are your projects successful, prompt.
The project success questions included; How well does your organization:
- Deliver to Committed Scope
- Deliver to Committed Timelines
- Deliver Expected Value or Revenue
- Deliver Expected Quality
- Drive Customer Satisfaction
In addition to the questions above, we also asked how well the respondents could close projects and how frequently they had to address project issues (fire fighting).
-
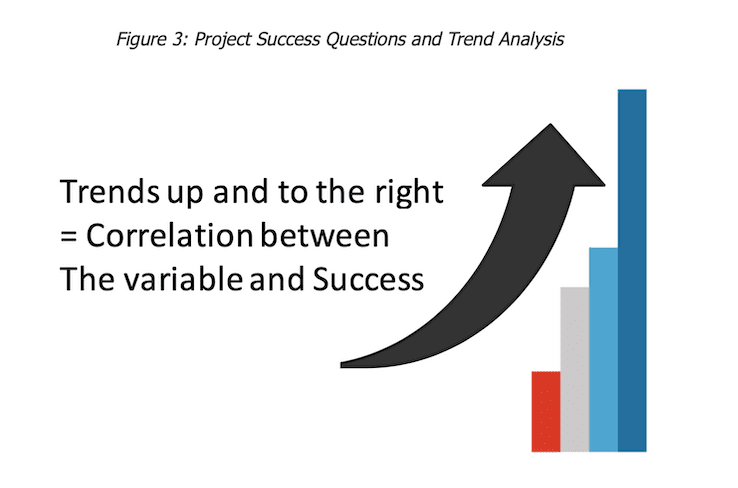
Figure 3: Project Success Questions and Trend Analysis
Complying with the answers to these questions and performing an analysis to chart the trends. A trend that moves “up and to the right” indicates a correlation between the variable and project success (Figure 3).
The 5 Key Findings Overview
After analyzing the trends, the survey revealed five key findings that we will discuss in each section in great detail. The five key takeaways that we will discuss are:
- The mere act of tracking project financials correlates directly with every measure of project success.
- Organizations with high levels of process compliance have a 4x better ability to close out projects.
- The quality of your data matters.
- Integrating PM tools with other systems helps the project’s success, especially in measuring customer satisfaction.
- Everyone fights fires, regardless of PMO maturity level.
Some of these conclusions supported our assumptions, while others served to raise more questions and will be the basis for future research topics. The important thing to note when it comes to project success is it is always worth the effort to implement tools and processes to drive quality data.
Tracking Project Financials Correlates with Project Success
Across every measure of success, including scope, schedule, cost, quality, resourcing efficiency, customer satisfaction, and the ability to close projects efficiently, organizations that track and report on project financials are better off than those that do not (Figure 4).
-
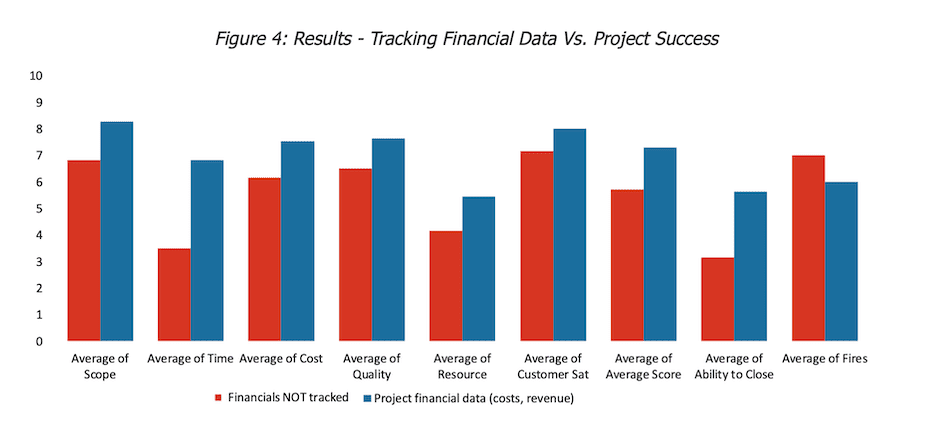
Figure 4: Results – Tracking Financial Data Vs. Project Success
As Figure 5 shows, each of the measures of project success had a strong correlation when the respondents indicated they track and report project financials. Also noticeable is that the average of fires increased with those that did not track financials.
-
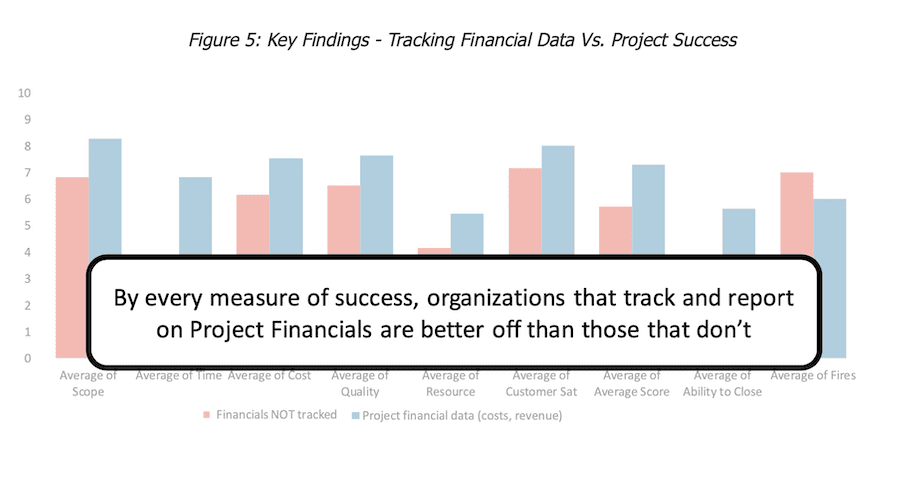
Figure 5: Key Findings – Tracking Financial Data Vs. Project Success
Likely several factors are driving this correlation. Financials are often tied with specific metrics that aid in project planning and decision-making, including change management, risk analysis, and monetary goals. When a project manager or PMO leader can quantify the problem or impact with a cost association, this makes decision-making for organizational leadership much clearer.
On average, organizations that report on project financials have other guardrails in place for project governance, including standardized project prioritization, selection and budgeting processes, procurement policies, and delivery tracking, which drive compliance with financial policy. These, along with other financial visibility or policy concerns, drive project and portfolio leaders to have a higher level of scrutiny on the tracking and are rigorous in their reporting of their financial data.
We recommend reviewing the tracking of financial information at the project and portfolio level and looking for opportunities to provide better visibility into this tracking.
If your project organization is not currently required to track project and portfolio-level financials, we strongly suggest doing so. Proactively monitoring and reporting on project financials can drive more data-driven discussions and decision-making around project delivery.
Process Compliance Increases the Ability to Close a Project by 4X
Although it may be intuitive that increased process compliance drives project success, the surprising outcome of our findings is that process compliance is most impactful when it comes to successful project closure (Figure 6).
-
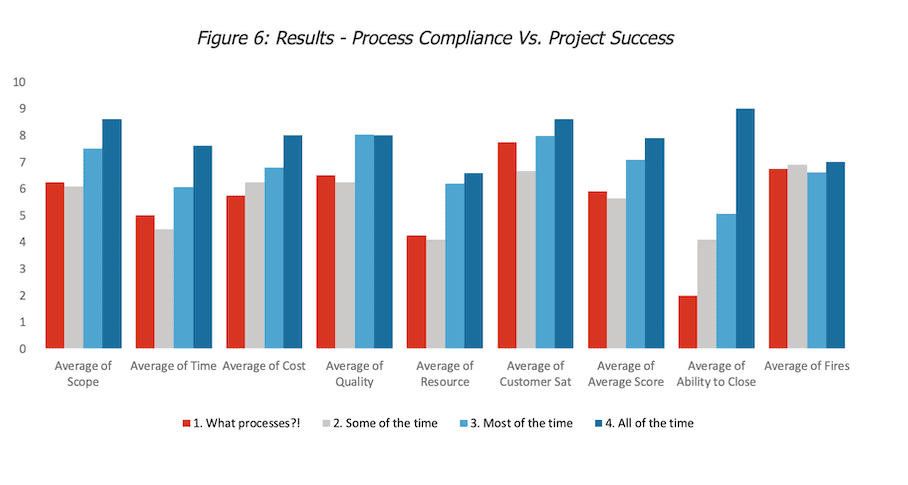
Figure 6: Results – Process Compliance Vs. Project Success
Figure 7 highlights that the ability to close a project increases by a multiple of four when following process compliance.
-
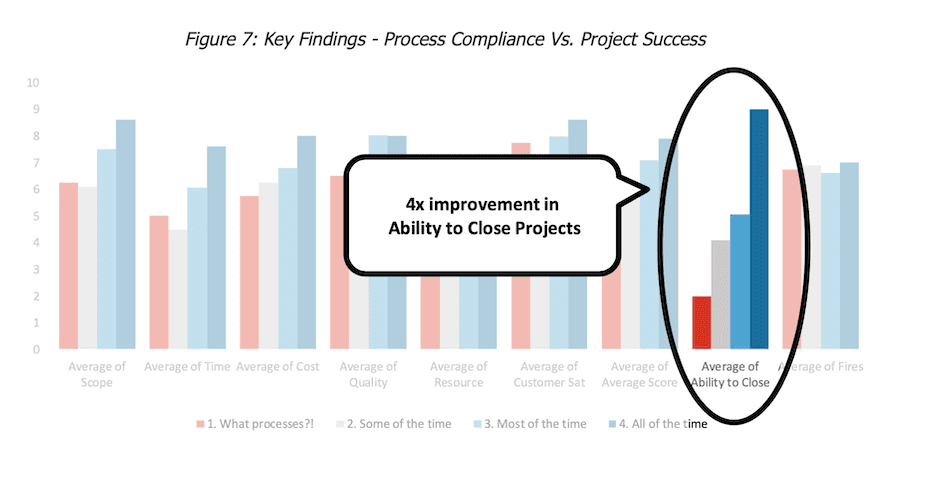
Figure 7: Key Findings – Process Compliance Vs. Project Success
This key finding is logical since it is during the closing phase when signoffs are documented, success metrics and project reports are finalized, and projects are transitioned to standard operating procedures.
We hypothesize that closure is where “the rubber meets the
road” when it comes to delivery, and where management issues earlier in the project will manifest themselves if they have not already.
Suppose an organization does not follow or have project processes in place. A project could appear well in hand until the project’s deliverables are handed off to the customer or ongoing owner. That is where problems may then become apparent. Attention to these closure details is essential.
Our recommendation is to start at the end, the closure phase, of your project lifecycle to expose the opportunities or gaps in your processes.
For example, tracking the Project Plan Close Date Vs. the Actual Close Date may be a good starting point. PPM tools that provide data integrity options like date stamping or change reporting can help monitor these trends for analysis.
See our whitepaper on PPM Platform Differentiators.
The Quality of Your Data Matters
In customer satisfaction, resource usage, and ability to close, organizations that reported having reliable and accurate project data showed a noticeable improvement in project success (Figure 8).
-
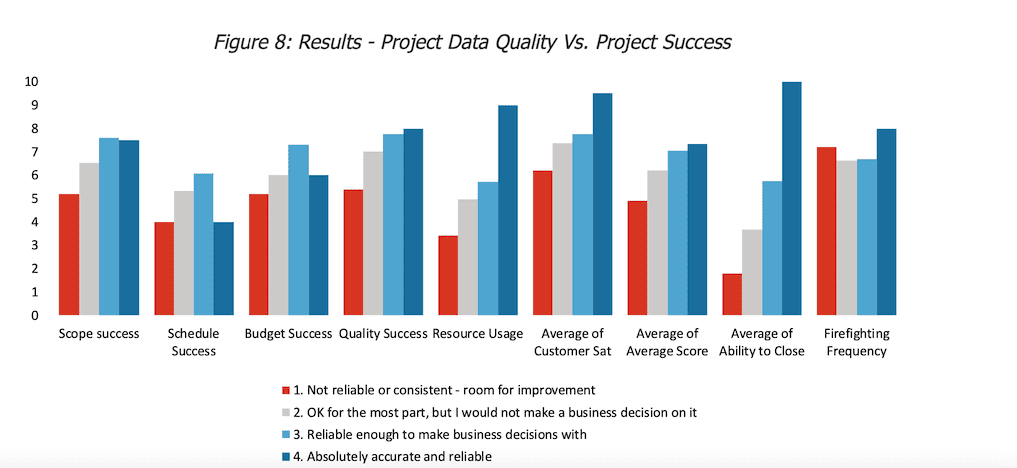
Figure 8: Results – Project Data Quality Vs. Project Success
As Figure 9 shows, efficient resource usage had an improvement of 62%, customer satisfaction had a gain of 33%, and as seen in Figure 10, the ability to efficiently close a project increased by a multiple of five compared to those with unreliable or inconstant data.
-
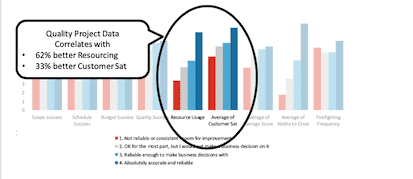
Figure 9: Key Findings (A) – Project Data Quality Vs. Project Success
-
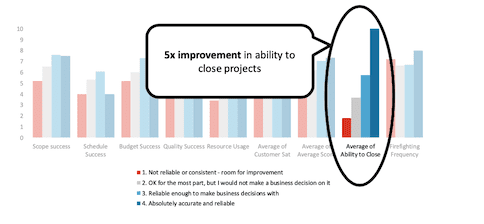
Figure 10: Key Findings (B) – Project Data Quality Vs. Project Success
Similar to the key finding of tracking financials, the results here are intuitive – the more accurate and reliable project data, the higher the correlation with project success.
With the right tools and processes to collect and present quality data, a PMO leader or project manager can clearly see their projects. As projects continue to meet other measures of success, such as budget and scope, closure and customer satisfaction also increase.
We recommend assessing tracked data currently within your project and PMO reporting ecosystem. If you rate it less than reliable or accurate, there is room for improvement, and attention to increasing its reliability will aid in project success.
PPM tools that provide collaboration, mobile support, and integrations with your issue-tracking software, like Jira, can help streamline processes and increase adoption for data reporting.
Integrating PM Tools with Other Systems Helps Project Success, Especially Customer Satisfaction
Integrating a project or portfolio management tool with other systems within the organization showed a correlation to project success in most areas across the board (Figure 11).
-
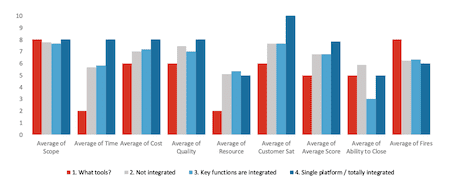
Figure 11: Results – Integrated Systems Vs. Project Success
Figure 12 shows that the standout project success correlation was with Customer Satisfaction.
Customer Satisfaction and project success correlation is an area that we would like to explore further; however, our initial evaluation suggests that internal customers’ satisfaction could increase with more visibility or ease of use across applications.
External customers could have increased satisfaction because of well-designed processes that help things go smoothly.
For example, financials billed and reconciled appropriately could increase customer satisfaction. Additionally, with all the other success measurements correlating to project success, the customer will intrinsically be happier.
-
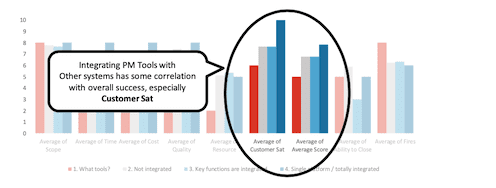
Figure 12: Key Findings (A) – Integrated Systems Vs. Project Success
Notably, not having project management tools is the best indicator of having more project fires. As Figure 13 shows below, there is a 20% likelihood of issues related to project delivery for organizations that do not have tools than those with integrated PPM systems.
With the tools in place, a project team, customer, or additional stakeholders, may have the forum to identify or escalate risks and issues before they become fires.
We recommend evaluating the tech stack at your organization and seeing where there may be opportunities to integrate and streamline processes and tools.
Leading an initiative for a value stream map or end-to-end journey through the different roles within your organization could provide several key learnings within your processes.
-
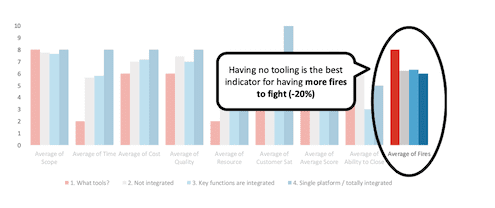
Figure 13: Key Findings (B) – Integrated Systems Vs. Project Success
Everyone Fights Fires, Regardless of Maturity Level
The survey revealed a final exciting conclusion. We learned that regardless of PMO maturity or process adoption, there will always be fires to fight (Figure 14).
-
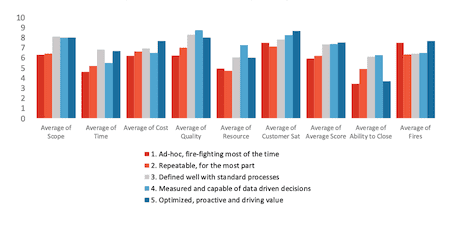
Figure 14: Results – PMO Maturity Vs. Project Success
As Figure 15 highlights, when it comes to the frequency of having to put out fires related to project delivery, there is seemingly no advantage between a PMO that considers themselves as an ad-hoc department (where most of the teams time is fighting fires) to one that sees themselves optimized and driving value within their organization.
-
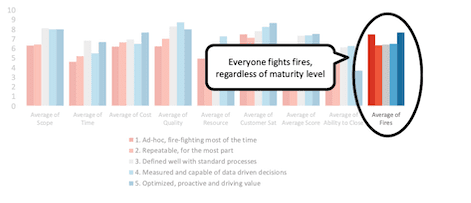
Figure 15: Key Findings – PMO Maturity Vs. Project Success
Since this was an unanticipated revelation, this discovery is another analysis we would like to explore further.
Some additional questions this raised for us include:
- Do the types of fires change?
- Does the ability to identify the fires improve with maturity?
What’s Next? Items for Additional Research
Data Feedback Loop – A Hypothesis
In reviewing the survey results and correlations, we discovered the presence of a feedback loop between data and project success. Depending on the consumption and reliance on project data, the loop spirals up or down (Figure 16).
-
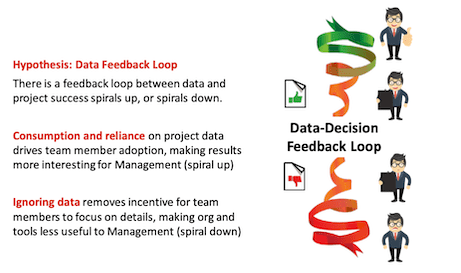
Figure 16: The Data Feedback Loop
Hypothesis: Data Feedback Loop
There is a feedback loop between data and project success spirals up or spirals down.
Consumption and reliance on project data drive team member adoption, making results more interesting for Management (spiral up). Ignoring data removes the incentive for team members to focus on details, making org and tools less useful to Management (spiral down)
We theorize that when an organization’s leadership has access to quality, reliable project data, they can make better decisions and will be more eager to consume it.
As leadership demand for quality data increases, the project team has more incentive and awareness of the visibility of their data reporting and, in turn, will pay attention to the quality of that data. The data quality improves with more time and focus, further increasing leadership demand.
Contrast this scenario with a project team unable or unwilling (due to a lack of tools, processes, or resource constraints) to invest time and effort to provide quality data. The leadership team would find the data unreliable and would not consume it.
The project team would feel further disincentivized to take the time or follow processes needed to provide quality data. This lack of follow-through feeds the confirmation bias management has that the data is unreliable and unimportant, feeding the spiral downward until any reporting becomes useless.
An Unsettling Discovery on the Perception of Project Management
Although the project management profession has been developing as a distinct and valuable management discipline since the late 1960s4, there is some work to do on the perception of project management and the value it delivers to organizations.
Our survey found a startling statistic where over half (53%) of respondents indicated that the perception of project management is either a roadblock or as having no more value as an administrative function within their organization (Figure 17).
-
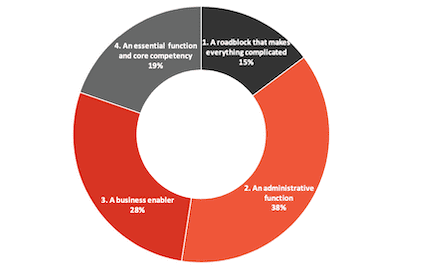
Figure 17: Results – How Project Management is Perceived
What Steps to Take to Assess Your Project Processes, Tools, and Data
Determine if your project delivery teams are tracking project-level financial data, and determine if there are ways to provide more visibility and better controls. The better your financial data and the more you can use it for decision-making, the greater your chances of project success in every dimension.
Start tracking how efficiently you can close projects. The most effective metric compares the baselined completion and actual completion dates. Analyze instances where there is a significant gap between the baseline and actual completion dates and look into the causes, focusing on process issues. You may find that projects that had problems closing had similar issues.
Look at your project and PMO reporting at your organization and analyze the quality of the data currently tracked and used within your reporting.
Is it accurate enough for you and your organization to make a business decision? If not, you may miss an opportunity to help your team and leadership make better data-driven decisions.
Evaluate the tech stack in your project organization and see where there may be opportunities to integrate and streamline processes and tools with other teams like Finance.
Integrating tools helps integrate data and processes, which can provide transparency in project delivery.
Get Insights and Ideas
As helpful as good documentation is, the support of an advisor is even better. Our consultants are here to help you and are available for you to pick our brains about how a project and portfolio management tool can give you the data you need to make the right business decisions and drive execution.
If you would like our assistance with any of the recommendations or to provide additional input on your specific enterprise organization, PMO, or project lifecycle, don’t hesitate to Contact Us.
Let’s discuss your needs over a quick 30 min chat.
Contact Us